Data Analysis Using CasaXPS
Herein, we give a (brief!) guide to help you in the right direction on the analysis of your data, utilising CasaXPS software.
Should you wish to know more about XPS (and surface analysis in general), CasaXPS, data quantification etc, we recommend the following resources:
| XPS Primer – Cardiff University XPS Access Service (Draft) | D. Morgan | Download PDF |
| CasaXPS Manuals | N. Fairley | Web Link |
| An Introduction to Surface Analysis by XPS and AES | J.F.Watts and J.Wolstenholme | (ISBN13: 978-0470847138) |
| Surface Analysis – The Principle Techniques (2nd Ed.) | J. Vickerman | (ISBN13: 978-0470017647) |
| Surface Analysis by Auger and X-Ray Photoelectron Spectroscopy | Ed. D Briggs and J.T. Grant | (ISBN10: 1901019047) |
| Surface Analysis of Polymers by XPS and Static SIMS | D. Briggs | (ISBN13: 978-0521352222) |
| High Resolution XPS of Organic Polymers: The Scienta ESCA 300 Database | G. Beamson and D. Briggs | (ISBN10: 0953784843) |
| Handbook of Surface and Interface Analysis: Methods for Problem-Solving (2nd Ed.) | J.C Riviere and S. Myhra | (ISBN13: 978-0849375583) |
Screen Cams (Copyright Neal Fairley)
Neal, also now has many more excellent videos on the CasaXPS YouTube channel
| A Beginners Guide to CasaXPS – Series of introductory videos for the basics of CasaXPS (e.g. energy calibration, survey quantification etc) |
| Quantification of Narrow Scan Regions and Curve Fitting – Series of videos relating to narrow (high resolution) scans |
| Quick Answer Screen Cams – Includes spectrum overlays, spectrum calculator, export Simple VAMAS format, report configuration and more |
| Long Answer Screen Cams – Includes Sputter depth profiles, RSF tables for Kratos, Quantifcaiton of Kratos/Specs/Thermo data, modelling high resolution data etc |
| Browsing Data in Experiment Frames | Spectrum Processing & Quantification | Peak Fitting of High Resolution Spectra |
| Basic Selection Mechanism | Energy Calibrate a Survey Spectrum | Create a Basic Peak Model |
| Merging Files and Overlaying Spectra | Create a Quantification Region | Adding Component Constraints to a Peak Model |
| Display Options for Spectra | Create Quantification Regions on a Survey | |
| Manipulating the Display and Identifying Peaks |
Other Analysis Methods
(1) Overlayer Thickness
The ‘Thickogram’, developed by Cumpson (Surf. Interface Anal. 29, 403-406 (2000)) is a useful graphical method for measuring overlayer thicknesses in samples where the overlayer has a different elemental chemistry than the substrate (e.g.: Yttria on top of a silicon wafer). The method is useful as it has the following advantages:
1) Uniform surface contamination is unimportant (e.g. adventitious carbon layer)
2) Instrumental factors common to oxide and substrate cancel
3) Simplistic equation
4) Works over a wide range of film thickness’s
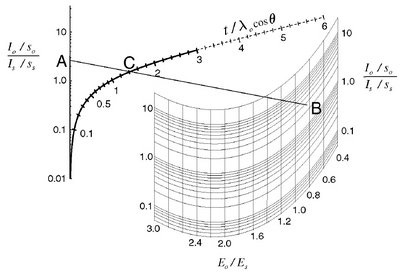 (Click on the image for a downloadable version of the Thickogram worksheet)
1) The emission angle must be between 0 and 60 degrees (i.e. Take-off angle of 90 to 30 degrees); Emission angles ca. 45 degrees are the most accurate
2) Method is applicable to a wide range of Kinetic Energies above ~500 eV
3) Results have an associated error of +/-10% (based on accuracy of attenuation lengths obtained by calculations)
(2) Oxide Overlayer Thickness (Especially Si and Al)
If the metal:oxide ratio can be determined for a thin film oxide sample (~0-9 nm) and if the inelastic mean free path (IMFP, λ) of the metal λm) and oxide (λox) is known (or calculated), the oxide film thickness (Amstrongs) can be calculated using the calculations of the type developed by Carlson (J. Elec. Spect. Relat. Phenom, 1972/73; 1, 161) and Strohmeier (Surf. Interface Anal. 1990, 15, 51) which are defined as follows:.
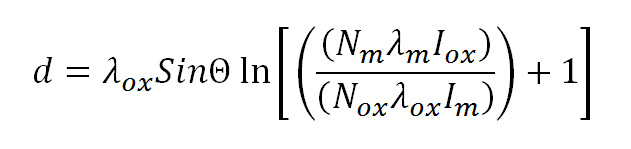
Where θ is the photoelectron take-off angle, Iox and Im are the percentage areas of the oxide and metal peaks fitted from the high-resolution spectrum, and Nm and Nox are the volume densities of the metal atoms in the metal and oxide. Note that this equations assumes Iox and Im originate from similar photoelectron energies.
3) Overlayer Thickness on Particles and Fibres (‘XPS Topofactors’)
Shard et al. (Surf. Interface Anal. 2009, 41 (7) 541-548) introduced the concept of XPS ‘Topofactors’, which can be used in conjunction with the ‘Thickogram’, to provide overlayer thicknesses on topographic samples of known geometry. Their concept is simple; analysis is performed with the sample normal directed towards the XPS analyser, the equivalent planar thickness is calculated from the Thickogram and the Topofactor applied to the result to provide the actual thickness.